Understanding the Role of Trading Strategies in Crypto Trading Bots


Table of Contents
Share
5 min read
Crypto Trading is one of the emerging trends worldwide, offering the potential for significant profits. Traders invest substantial amounts into digital assets, aiming to capitalize on the dynamic cryptocurrency market. However, the risk of substantial losses is also high due to the market’s volatility and rapid price fluctuations, the risk of substantial losses is also high. Not every trader is equipped with market insights or has the time to conduct market research and analyse trading patterns before investing in cryptocurrency.
In that case, crypto trading bots serve the purpose phenomenally. Crypto trading bots are automated computer software designed to execute trading anytime to yield profits. These bots are driven by artificial intelligence and machine learning. They collect data from multiple sources on the Internet, analyse trading patterns, and execute transactions accordingly. Their working mechanism highly depends on the trading strategies integrated into these computer programs. In this article, we will learn about crypto trading strategies and their applications in crypto trading bots.
What are Crypto Trading Strategies?
Crypto trading strategies are techniques for entering the dynamic and volatile cryptocurrency market. These strategies give users a competitive edge over those who still follow the manual process. Crypto trading strategies can be applied for both short-term and long-term benefits. The right trading strategies can mitigate risk to a certain level and help users earn profit regardless of whether prices are dropping or rising. With the crypto market experiencing unprecedented growth and constant evolution, mastering the development and refinement of trading strategies has never been more crucial for success.
When using automated crypto trading bots, checking which trading strategies the bot follows is essential and empowering. Trading strategies are integrated into the bots during the development phase, and the bots are designed to execute trades according to these strategies. People can choose different trading strategies according to their requirements, giving them control over their investments.
Types of Trading Strategy
Mean Reversion Strategy
The mean reversion strategy helps traders navigate the volatility of the crypto market, allowing them to profit from price fluctuations. According to this theory, asset prices and historical returns tend to move towards their long-term average levels.
By identifying overbought and oversold conditions, traders can purchase cryptocurrencies at lower prices and sell them at higher prices. The Relative Strength Index (RSI) and Bollinger Bands assist in pinpointing these market ups and downs. Mean reversion strategies include moving average, pair, and volatility strategies.
Relative Strength Index (RSI) Indicator
RSI analyses cryptocurrency price fluctuations to determine which are overbought or oversold. Visually, it is represented by an oscillator that moves in the range of 0-100. If the oscillator moves up to 70, the asset is considered overbought, and if it comes down to 30, the asset is considered oversold.
RSI is among the most used techniques for tracking the short-term momentum of the crypto market. When RSI is blended with other trading strategies, the combination helps the traders make informed decisions and reduces the potential market risks.
MACD Trading
The MACD trading strategy, or Moving Average Convergence Divergence, is among the most widely employed techniques in cryptocurrency trading. It helps traders identify shifts in price trends’ strength, direction, momentum, and duration for various cryptocurrencies. The MACD utilizes different signals, including crossovers, divergences, and histogram patterns, to provide insights into market movements. Like RSI, MACD also helps traders track the short-term momentum of cryptocurrencies.
Mathematically, MACD is represented as:
MACD = Short-term EMA – Long-term EMA
Signal line = Moving average of MACD line
Histogram = MACD line- Signal line
Fibonacci Retracement Strategy
The cryptocurrency market is known for its high volatility, which necessitates the use of advanced trading techniques to mitigate associated risks. One such strategy is Fibonacci retracement, which is widely regarded as one of the most effective and influential trading approaches in the crypto trading landscape.
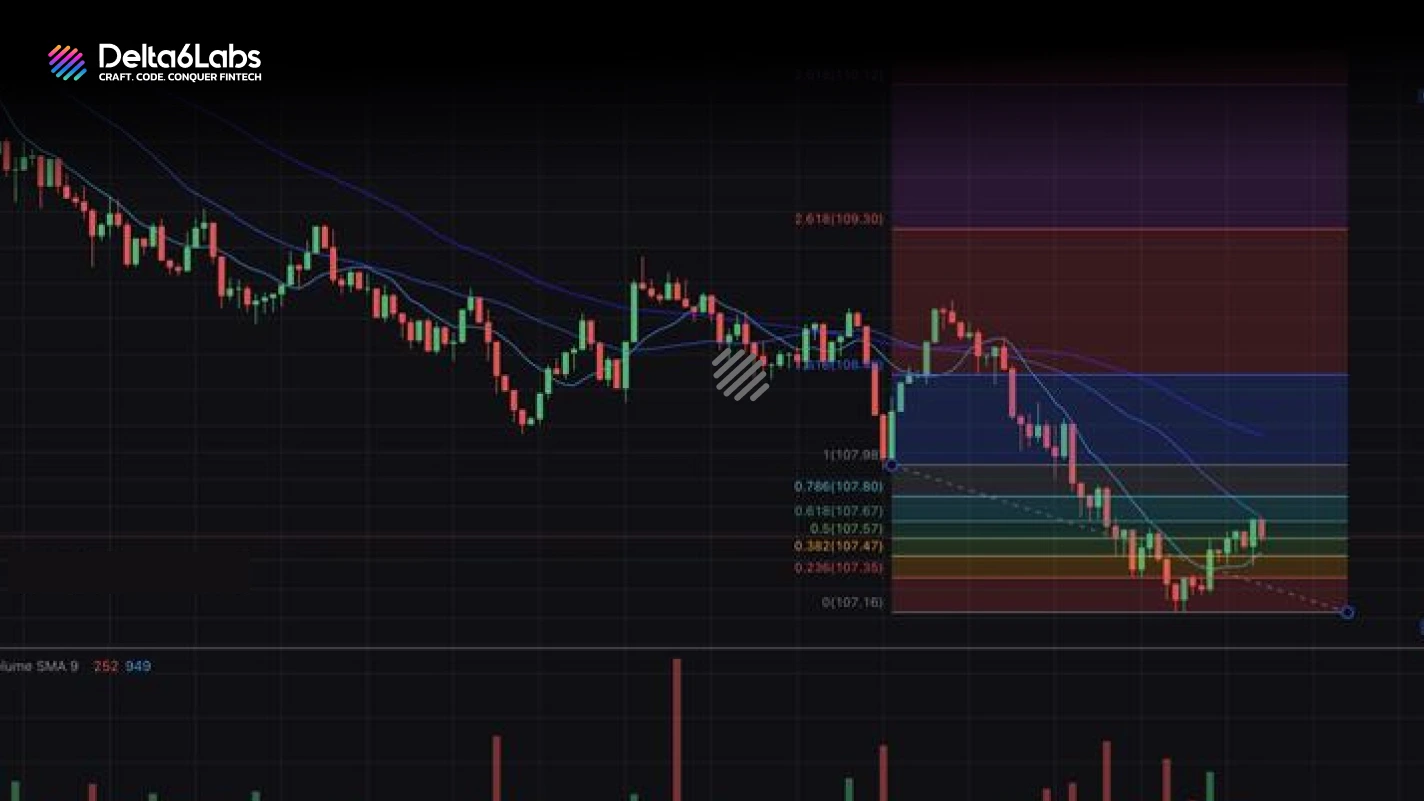
The Fibonacci sequence is a series of natural numbers where the ratio of a number to its immediate successor is approximately 0.618. Here is an example of a Fibonacci sequence:
0, 1, 1, 2, 3, 5, 8,13, 21, 34, 55, 89, 144, 233 ……. and so on.
In crypto trading, Fibonacci levels serve as powerful support and resistance indicators. Rooted in the renowned Fibonacci number sequence, these levels can provide traders with valuable insights into potential market movements and key price points. Unlike moving averages, Fibonacci retracement levels do not move frequently; they are static, making it easier for traders to determine support and resistance points.
The Fibonacci retracement has different lines, which are used to determine buying and selling points in crypto trading.
0.236 Fibonacci Retracement
This line is most suitable for the high momentum trade because it shows a high-volume trend.
0.5 Fibonacci Retracement
This is the most essential and effective use of the Fibonacci retracement tool. Since it represents the average price movement, many traders and algorithms typically buy at half the price.
0.618 Fibonacci Retracement
Combined with the 0.5 Fibonacci retracement, it creates an effective entry and exit level. The market can fluctuate between the 0.382 and 0.618 retracements, where optimal pullback trades occur. It is the reciprocal of the golden ratio (1.6180). It also represents the level at which most traders buy or sell their cryptocurrencies.
Pivot Reversal Strategy
The Pivot Point Reversal Strategy is a trading method that utilises support and resistance levels from pivot points to identify potential price trend reversals in the cryptocurrency market. By merging pivot points with other trading indicators, traders can recognise signals for entering or exiting trades based on possible reversals.
The analysis uses pivot points determined from the previous period’s high, low, and closing prices to identify key support and resistance levels. These levels act as reference points for traders to forecast future price movements. When the price nears a significant support or resistance level and displays signs of reversal, such as candlestick patterns or momentum indicators, it suggests a potential change in market direction.
Bollinger Bands Strategy
The Bollinger band strategy is a trading technique designed by John Bollinger, an American analyst. It utilises price volatility to determine exit and entry points in the crypto market. Bollinger band tool has three bands, and each band has its own significance in crypto trading.
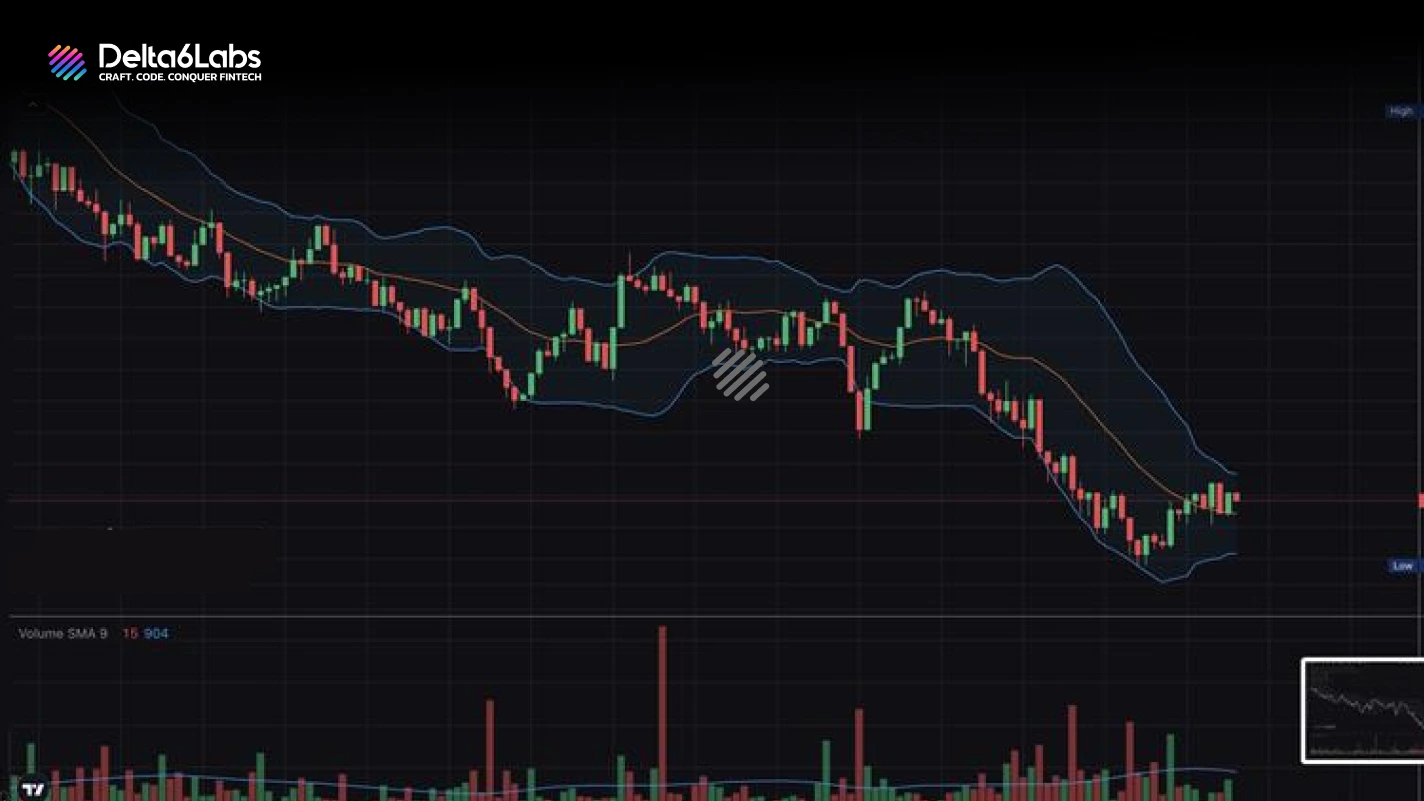
Middle Band
The middle band represents a cryptocurrency’s simple moving average (SMA) over an average of 20 days. The middle line indicates the baseline prices and helps traders understand the trend’s direction.
Upper Band
The position of the upper band is calculated by adding twice the standard deviation to the middle band value. If an asset’s price rises above the upper band, it means the asset is overbought and due for a pullback.
Lower Band
The lower band is calculated by subtracting twice the standard deviation from the middle band value. If an asset’s price falls below the lower band, then the asset is considered oversold and is awaiting a bounce.
Parabolic SAR Strategy
Parabolic SAR is a highly effective technique for analyzing price action. It plots dots on the chart to indicate potential trend reversals. SAR stands for “stop and reverse,” and the technique identifies entry and exit points as well as stop-loss placements. The stop and reverse feature of the Parabolic SAR strategy adjusts pricing to benefit traders, securing profits while reducing risk. The Acceleration Factor (AF) is also integrated with parabolic SAR tools for more accurate results.
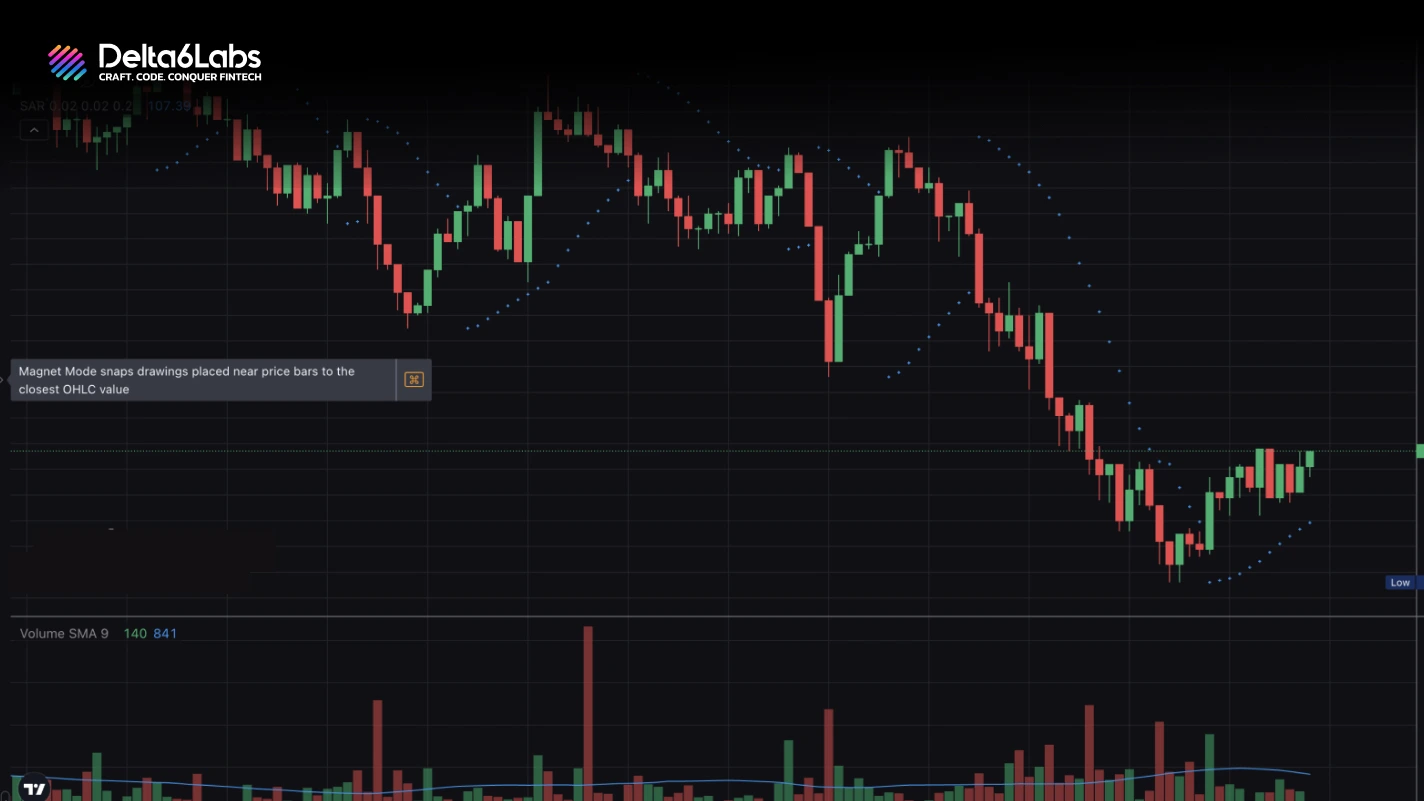
When SAR dots go below the price, they represent a potential uptrend; when they go above the price, they represent a potential downtrend.
Moving Average Strategy
The moving average strategy calculates the average price of any digital asset over a certain period. The most used time periods are 15, 20, 30, 50, and 100 years. The moving average strategy helps traders by smoothing out the volatility of the crypto market by forming a consistent trend line. There are various types of moving average strategy, such as:
- Simple Moving Averages
- Exponential Moving Averages
- Double Exponential Moving Averages
- Mesa Adoptive Moving Averages
- Kaufman’s’ Moving Averages
Martingale Strategy
Martingale’s trading strategy, started as a gambling strategy by Mr. and Mrs. Martingale for a casino, is proving its worth in the crypto trading world. It reduces average position cost by continuously increasing the position value. Layman’s idea behind the martingale strategy is that traders double their stake after each loss so that when they win, the winning margin balances the previous losses.
Dollar Cost Averaging
In the Dollar Cost Averaging strategy, traders invest a fixed amount of money with each trade, regardless of market trends. Whether the market is rising or falling, the investment amount remains constant. This strategy smooths out market volatility and reduces risks by making significant, single investments. DCA is a long-term investment strategy effective for beginners and seasoned traders. While DCA may not ensure higher profits than other strategies, its “set it and forget it” approach can particularly appeal to long-term investors.
Conclusion
Both ups and downs are an elementary part of the crypto market. Traders can profit in both circumstances, whether the market rises or falls. However, the Crypto market is more volatile than the traditional financial marketplaces. It is necessary to make informed decisions to mitigate the possible risks and earn profits. Manually, it is impossible to make such decisions because the human body has some physical and mental limitations. That’s when the trading bots come into the picture.
Crypto trading bots have significantly transformed the crypto trading landscape because they are much more efficient than humans, can work endlessly 24/7, and have no mental or physical limitations. However, crypto trading strategies are integrated with bot algorithms to make these bots more efficient. These strategies are designed using trading tools, charts, and mathematical calculations. They help traders find the entry/exit points and determine which assets are overbought and oversold.
These strategies are formed after extensive arithmetic, algebraic calculations, and data plotting as charts. Their sole purpose is to help traders earn profits in both upward and downward trends. In this ever-volatile crypto market, crypto trading bots Delta6Labs have proven their worth and significance in empowering traders to navigate the market’s tides smoothly.
Frequently Asked Questions
Relative Strength Index (RSI) analyses cryptocurrency price fluctuations to determine which are overbought or oversold. Visually, it is represented by an oscillator that moves in the range of 0-100. If the oscillator moves up to 70, the asset is considered overbought, and if it comes down to 30, the asset is considered oversold.
Crypto trading bots are automated computer software designed to execute trading anytime to yield profits. These bots are driven by artificial intelligence and machine learning. They collect data from multiple sources on the Internet, analyse trading patterns, and execute transactions accordingly.
In the Dollar Cost Averaging strategy, traders invest a fixed amount of money with each trade, regardless of market trends. Whether the market is rising or falling, the investment amount remains constant. This strategy smooths out market volatility and reduces risks by making significant, single investments.
Parabolic SAR is a highly effective technique for analyzing price action. It plots dots on the chart to indicate potential trend reversals. SAR stands for “stop and reverse,” and the technique identifies entry and exit points as well as stop-loss placements.
The moving average strategy calculates the average price of any digital asset over a certain period. The most used time periods are 15, 20, 30, 50, and 100 years. The moving average strategy helps traders by smoothing out the volatility of the crypto market by forming a consistent trend line. There are various types of moving average strategy, such as
--> Simple Moving Averages
--> Exponential Moving Averages
--> Double Exponential Moving Averages
--> Mesa Adoptive Moving Averages
Kaufman’s’ Moving Averages
Disclaimer:
The information on this blog is for knowledge purposes only. The content provided is subject to updates, completion, verification, and amendments, which may result in significant changes.
Nothing in this blog is intended to serve as legal, tax, securities, or investment advice of any investment or a solicitation for any product or service.
 Trending Topics